✨ AI Data Analysis Software for Qualitative and Quantitative Research
Data Analysis Software for Research, Business, and Surveys
DataLumio is data analysis software built for researchers, analysts, and business teams who need to clean, analyze, visualize, and report on data without writing a single formula.
Upload spreadsheets, survey exports, or PDF reports and get clear findings in minutes.


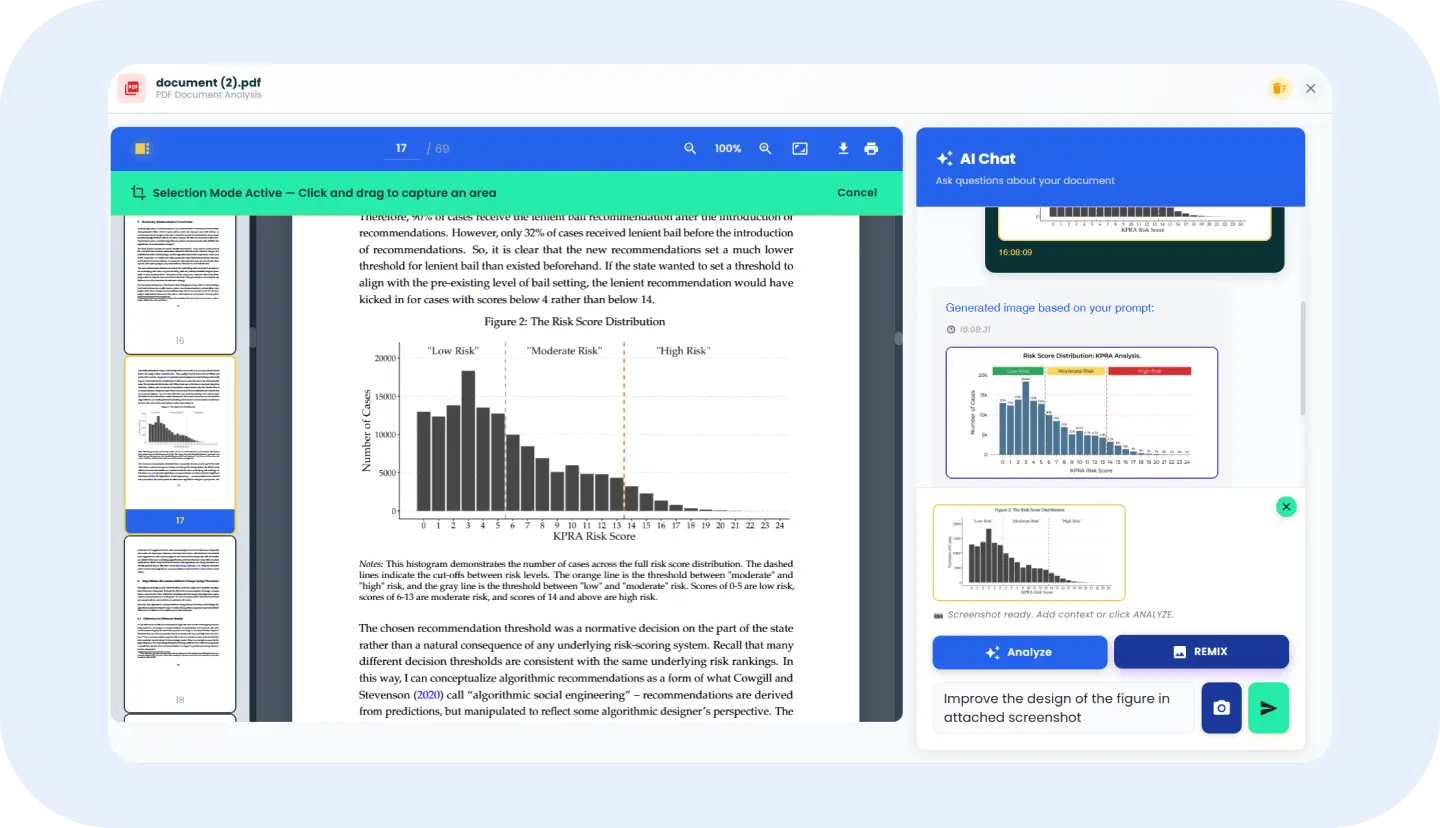
PDF Analyzer
Chat with PDF files and pull structured answers straight out of long research documents.
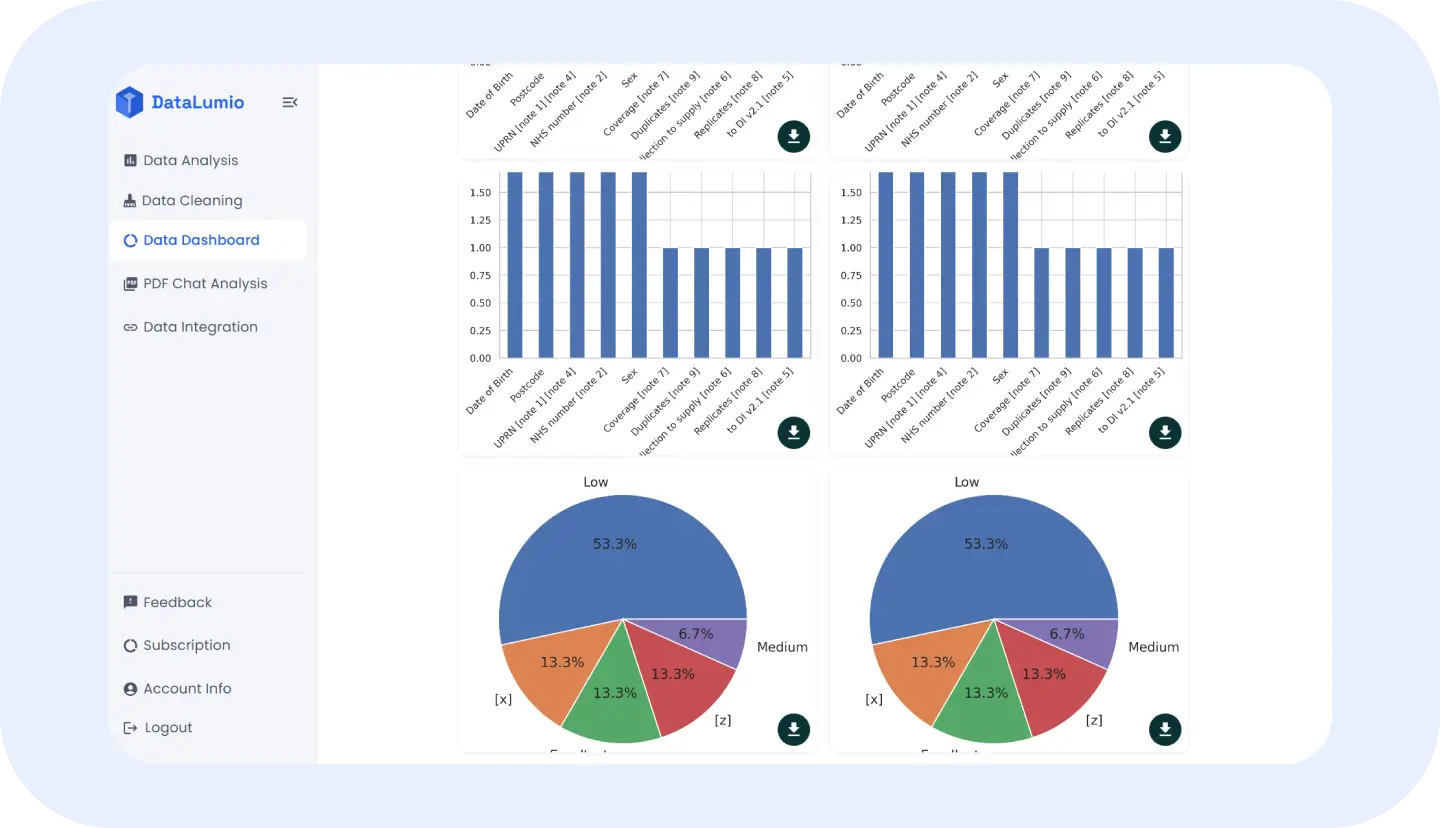
Data Visualization Dashboard
Turn cleaned datasets into a live data visualization dashboard your whole team can read.
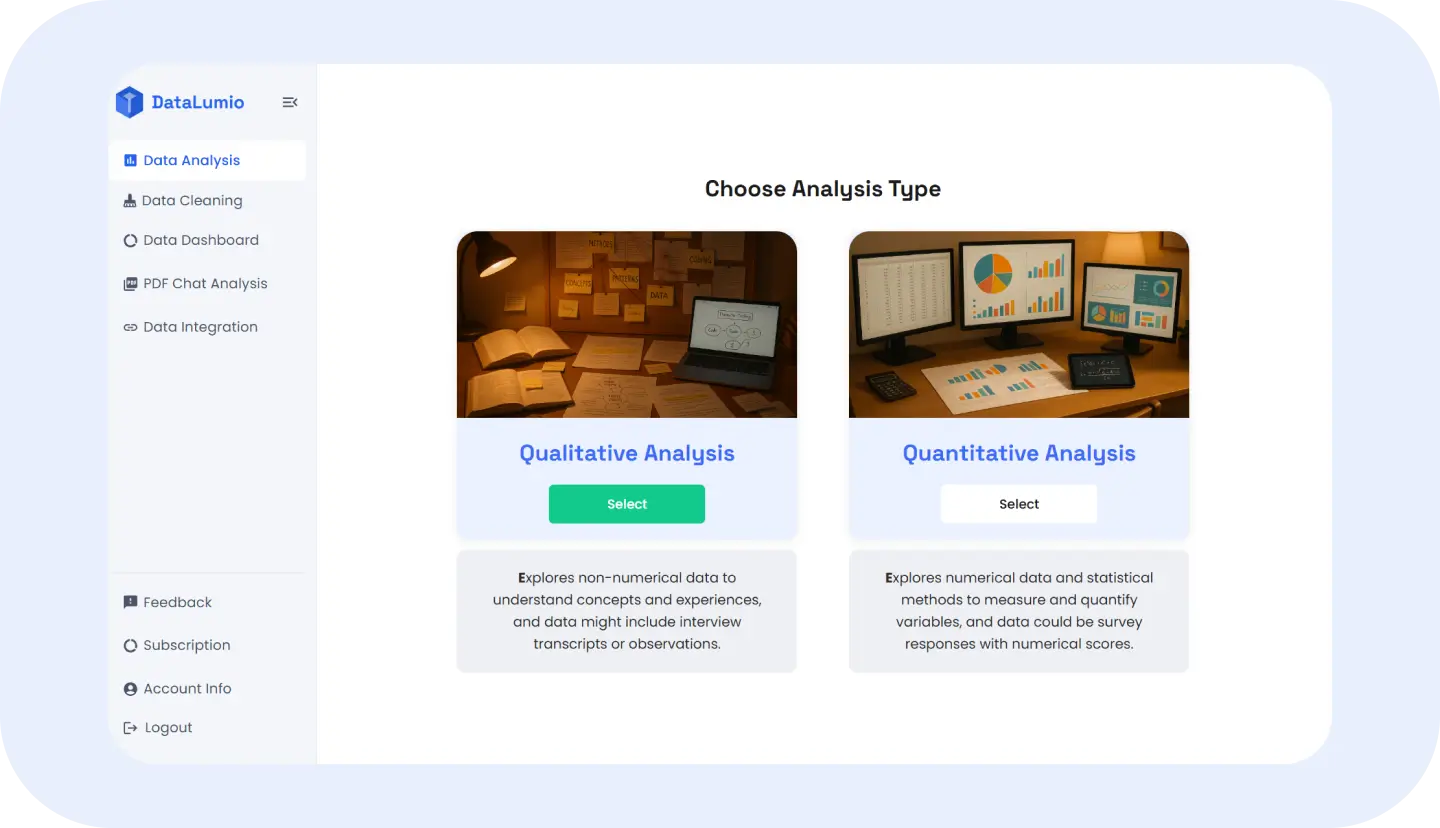
Qualitative & Quantitative Analysis
Run qualitative and quantitative data analysis side by side, on one platform, one dataset.
Turn Messy Data Into Clear Insights Without Manual Analysis
Most data analysis tools force a choice: powerful but complicated, or simple but shallow. DataLumio was built to remove that trade-off. Drop in a spreadsheet, a survey export, or a stack of PDF reports, and the platform handles the tools of data analysis that usually eat up a week of work, cleaning columns, coding open-text responses, checking for outliers, and laying out the first chart.
Whether your project depends on interview transcripts, customer survey scores, or a mix of both, DataLumio gives you one place to run the full data analysis process from raw file to finished report, without switching between spreadsheets, statistics software, and a separate design tool.
One Data Analysis Platform to Clean, Analyze, Visualize, and Report
DataLumio replaces the usual stack of spreadsheet, stats software, and slide deck with four connected steps.
Upload Data Files
CSV, Excel, survey exports, or PDF reports
Clean Your Data
Duplicate, missing, and mismatched values fixed automatically
Analyze Your Data
Qualitative coding and quantitative statistics together
Create Data Dashboards
Shareable data visualization dashboards, ready to present
The Process
Data Analysis Process: From Raw Data to Research-Ready Insights
A practical data analysis process designed to take you from raw files to reviewable findings without unnecessary setup, repetitive formatting, or scattered tools.
Upload or Connect Your Data
Start with spreadsheets, survey exports, research documents, or PDFs and bring your source files into one workspace.
Clean and Prepare Your Data
Identify common quality issues such as duplicates, missing values, and inconsistent fields before analysis begins.
Choose Your Data Analysis Method
Use qualitative data analysis for text, quantitative data analysis for structured numbers, or combine both for mixed-methods research.
Visualize Your Data
Turn findings into charts, comparisons, and a data visualization dashboard that makes important patterns easier to understand.
Review and Report Your Findings
Check the generated findings, apply your research judgment, and create a structured report ready to share or present. Keep final interpretation under your control while using DataLumio to organize the supporting evidence.
Data Analysis Examples for Research, Business, Surveys, PDFs, and Reports
A data analysis example from nearly every field runs through the same four steps inside DataLumio.
Academic Research
Analyze interview transcripts, field notes, literature-related documents, and survey datasets within one workflow.
Student Projects
Turn class datasets and research files into understandable findings, charts, and reports without learning complicated software first.
Survey Data Analysis
Combine numerical responses and open-ended feedback to understand both measurable trends and the reasons behind them.
Business Data Analysis
Transform recurring spreadsheets into clearer dashboards and reports for performance reviews, planning, and decision-making.
Customer Feedback Analysis
Analyze reviews, support conversations, and open-text responses to identify recurring themes, concerns, and opportunities.
PDF Data Analysis
Ask questions across research papers, business reports, policies, and other long documents to find relevant information faster.
Marketing Data Analysis
Compare campaign metrics with customer feedback to understand performance alongside audience sentiment.
Financial Data Analysis
Review structured records, identify irregular entries, and organize findings before formal reporting or deeper analysis.
Qualitative and Quantitative Data Analysis in One Platform
Many research questions require more than one type of evidence. DataLumio keeps qualitative and quantitative workflows connected so you can examine what people said alongside what the numbers show.
Qualitative Data Analysis
Understand the Why Behind the Numbers
Analyze interviews, open-ended survey responses, transcripts, and other text-based data to identify themes, patterns, sentiment, and supporting evidence.
Quantitative Data Analysis
Confirm Patterns With the Numbers
Explore survey scores, structured datasets, and numerical records with summaries, relationships, trends, and visual outputs that support evidence-based interpretation.
Create Data Visualization Dashboards and Insight Reports
Turn analyzed datasets into data visualization dashboards that bring charts, comparisons, and key findings together in one readable view. DataLumio connects visual outputs with the underlying analysis, helping teams understand not only what the data shows but also why the finding matters.
Use dashboards and reports to communicate research results, business performance, survey findings, and analytical insights without rebuilding the same information across separate tools.
Data Protection
Secure Data Analysis With Privacy, Control, and Confidence
Data analysis often involves research files, business records, survey responses, and other information that deserves careful handling. DataLumio uses encryption in transit and at rest and provides controlled access so you can decide file access.
Encrypted Data Storage
Protect files during upload, processing, and export.
Controlled Data Access
Invite people who need access to your projects and data.
Your Data Stays Yours
Uploaded data is not used to train AI models.
📊 Why DataLumio?
Why Choose DataLumio as Your Data Analysis Tool?
Spreadsheets are useful for many tasks, but they are not designed to handle every stage of modern data analysis. Switching between spreadsheets, statistical tools, PDF readers, visualization software, and reporting templates can create repetitive work and make it harder to keep findings consistent.
DataLumio brings key data analysis tools into one web-based workspace, helping you clean, analyze, visualize, and report from connected data workflows. Spend less time moving information between tools and more time interpreting results with a clearer, more organized process.
Start Your Data Analysis With DataLumio Today
Upload your data, analyze a PDF, or connect a supported source and start exploring findings in one workspace. DataLumio helps you move through the data analysis process faster, from cleaning and analysis to visualization and reporting.