InsightsWorkflow Steps

How DataLumio Helps You Analyze Data in Minutes

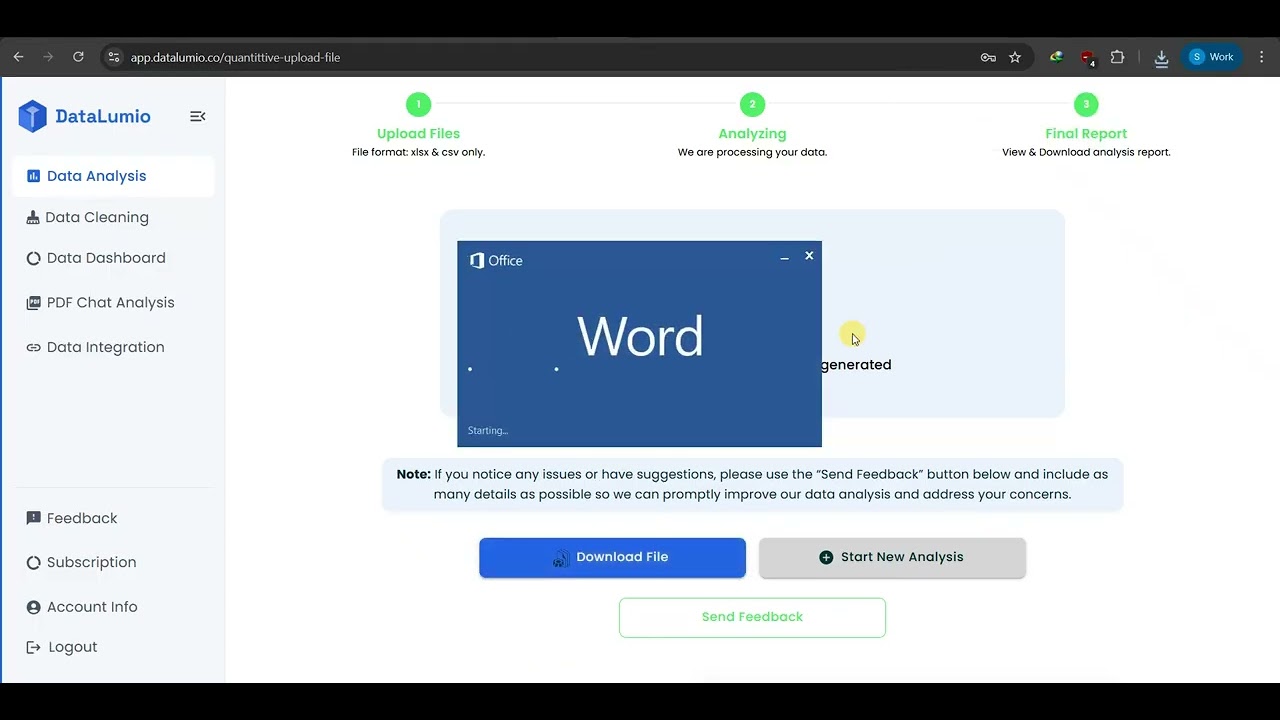
See how DataLumio helps turn raw files into clearer insights. In this demo, you’ll get a practical look at how the platform supports data cleaning, qualitative analysis, quantitative analysis, PDF chat, dashboard generation, and report creation.

DataLumio Demo Preview

What You’ll Learn in This DataLumio Demo

In the demo, you’ll see how DataLumio helps users move from raw files to useful outputs without coding or manual setup.

You’ll see how to:

  • Upload spreadsheet and doc files such as CSV, XLS, XLSX or Doc.
  • Clean common data issues before running analysis.
  • Use quantitative analysis to generate statistical summaries and charts.
  • Use qualitative analysis to find themes, quotes, and patterns in text-based files.
  • Chat with PDFs and ask questions about long documents.
  • Create interactive dashboards from uploaded data.
  • Download reports or individual chart outputs where available.
  • Use DataLumio as a practical starting point for research, reporting, and business analysis.

The goal of the demo is to show the product in context, not just list features. You’ll see how different tools connect across the full data analysis process.

How DataLumio Turns Raw Data Into Clear Reports

1

Step 1: Start With a File

Most users begin by uploading a file. This could be a spreadsheet, a PDF, a research document, a survey export, or a report. DataLumio is built to support different file-based workflows, so the first step is simply choosing the feature that matches your data type.

For spreadsheet data, users can move into cleaning, quantitative analysis, or dashboards. For text-heavy documents, users can choose qualitative analysis. For PDFs, users can open the file in the PDF chat workspace and ask questions directly.

2

Step 2: Clean or Prepare the Data

If the file is messy, DataLumio can help prepare it before analysis. The data cleaning workflow helps deal with common spreadsheet issues such as duplicate rows, empty rows, blank columns, and missing values. Cleaner data gives users a better starting point before creating charts, reports, or statistical summaries.

3

Step 3: Ask AI Questions or Run Analysis

Once the file is ready, users can either ask AI questions or generate a structured analysis. For PDFs, this means opening the document and chatting with it. For qualitative files, this means identifying themes, quotes, sentiment, and summaries. For quantitative files, this means generating descriptive statistics, charts, outlier checks, and other useful outputs depending on the dataset.

4

Step 4: Visualize the Results

DataLumio can turn spreadsheet data into interactive dashboard views. Users can choose a dashboard style or use AI Smart Mix to generate a suitable set of charts automatically. Each chart can be explored and downloaded individually, making it easier to reuse visuals in reports, presentations, or internal updates.

5

Step 5: Review and Use the Output

The final step is reviewing the output. DataLumio can generate structured reports, charts, summaries, and visual insights, but users should still check important results before using them in research, business, or decision-making. The platform helps speed up the workflow, while the user remains in control of interpretation.

Explore Demo Examples for PDFs, Surveys, Spreadsheets, and Research

PDF Documents

The PDF demo shows how users can upload a PDF, open it in the viewer, and ask questions about the document. This is useful for research papers, business reports, policy documents, financial summaries, and long documents that are difficult to review manually.

Related feature: PDF Chat Analysis

Survey and Spreadsheet Data

For structured data, the demo shows how DataLumio can process spreadsheet files and generate summaries, charts, and analysis outputs. This is useful for survey responses, customer records, sales data, operational reports, and research datasets.

Related feature: Quantitative Data Analysis

Interview Transcripts and Research Notes

For text-based research files, DataLumio can help identify themes, extract supporting quotes, detect sentiment, and generate a structured report. This is useful for students, PhD researchers, UX teams, consultants, and anyone working with qualitative material.

Related feature: Qualitative Data Analysis

Messy CSV or Excel Files

The demo can also show how DataLumio helps clean spreadsheet data before analysis. This is useful when a file includes duplicates, empty rows, blank columns, or missing values that need to be handled before the dataset is useful.

Related feature: Data Cleaning

Dashboards and Visual Reports

For users who need visual outputs, the dashboard workflow shows how uploaded data can become interactive charts and summary views. This is useful for business reports, client presentations, survey dashboards, and performance reviews.

Related feature: Data Visualization Dashboard

From Messy Files to Clean Dashboards and Insight Reports

The real value of DataLumio is in the shift from raw input to usable output.

A messy spreadsheet can become a cleaner dataset that is ready for analysis. A CSV file can become a quantitative report with tables, charts, and plain-language insights. A long PDF can become a document you can question directly. Interview transcripts can become a structured qualitative report with themes, quotes, and summaries. A spreadsheet can become an interactive dashboard with charts that can be explored and downloaded.

This saves time because users do not need to manually prepare every chart, search every PDF page, or organize every theme from scratch. DataLumio gives users a faster first draft of the analysis workflow. From there, they can review, refine, and use the outputs in their own research, reporting, or decision-making process.

The demo section visually shows this before-and-after journey: raw file on one side, clear output on the other.

Analyze Data Without Coding, Complex Formulas, or Manual Formatting

Not every user has time to learn Python, SQL, SPSS, Tableau, or advanced Excel formulas. Many researchers, students, marketers, consultants, and business teams simply need a faster way to understand the files they already have.

DataLumio is built for that kind of workflow. Users can upload a file, choose the right tool, and let the platform help with cleaning, analysis, visualization, or PDF review. The goal is not to replace advanced tools for every specialist use case. It is to make everyday data work more accessible for people who need clear outputs without a technical setup.

This is especially useful when users need to move quickly: checking a survey, preparing a report, reviewing a PDF, summarizing research notes, or creating visuals for a meeting. DataLumio helps reduce the slow manual steps so users can focus on understanding the results.

Try DataLumio With Your Own Data or Sample Files

After watching the demo, the easiest next step is to try DataLumio with a file of your own. Upload a spreadsheet, PDF, research document, or dataset and choose the workflow that fits your goal.

You can start with data cleaning, run a quantitative analysis, generate a qualitative report, chat with a PDF, or create a dashboard from spreadsheet data. If you are not ready to use your own file yet, sample files can help you test the workflow first.

Frequently Asked Questions About DataLumio

The demo shows how DataLumio supports common data workflows, including file upload, data cleaning, PDF chat, qualitative analysis, quantitative analysis, dashboard generation, and report outputs. It gives users a practical view of how the platform works before they try it.

Supported file types depend on the feature. PDF Chat Analysis supports PDF files. Qualitative Analysis supports PDF and DOC files. Quantitative Analysis and Data Cleaning support CSV, XLSX, and XLS files. Data Visualization Dashboard supports CSV, XLSX, XLS, and TSV files.

Yes. DataLumio includes a data cleaning workflow for common spreadsheet issues such as duplicate rows, empty rows, blank columns, and missing values. This helps prepare files before analysis or dashboard generation.

Yes. DataLumio includes PDF Chat Analysis. Users can upload a PDF, open it in a side-by-side viewer, and ask questions about the document. Chat history is saved for each individual PDF file.

Yes. DataLumio can generate interactive dashboards from spreadsheet files. Users can choose a dashboard template or use AI Smart Mix to let DataLumio select a suitable chart mix. Individual charts can be explored and downloaded.

Yes. DataLumio can generate structured reports from qualitative and quantitative analysis workflows. Reports may include summaries, tables, charts, quotes, sentiment labels, statistical outputs, and conclusions depending on the feature and uploaded data.

No. DataLumio is built for no-code data analysis workflows. Users do not need to write Python, SQL, formulas, or statistical code to get started. Some understanding of the file and project goal is still helpful when reviewing outputs.

DataLumio is designed for users working with research, business, and professional files. Uploaded content is handled through the platform’s secure workflow and is not used for public AI model training. Users working with sensitive files should still follow their organization’s privacy and data handling policies.

Start Your First AI Data Analysis Workflow Today

Watch the demo, then try DataLumio with your own file. Clean messy data, analyze spreadsheets, chat with PDFs, build dashboards, and generate reports from one AI-powered platform.