AI Data Analysis Software for Data Cleaning, Analysis, and Visualization
Turn raw research files, spreadsheets, PDFs, and datasets into clearer insights with DataLumio. Use AI-powered data analysis tools to clean messy data, analyze qualitative and quantitative information, explore documents, create data visualization dashboards, and generate structured reports — all in one simple workspace.
Data Analysis Process: From Raw Data to Actionable Insights
Data analysis often starts with incomplete, inconsistent, or difficult-to-understand information. DataLumio brings the essential stages of the data analysis process into one connected workflow — from upload and cleaning to analysis, visualization, and reporting, without unnecessary tool switching.
Most data work does not start with a clean, ready-to-use file. It often begins with a spreadsheet full of blank rows, a PDF report that is too long to read quickly, interview notes spread across documents, or survey responses that need to be summarized before they can be useful. DataLumio is designed around that real workflow — not an idealized version of it.
You can start by uploading or connecting your files. If the dataset is messy, use the Data Cleaning feature to remove common issues such as duplicate rows, empty rows, blank columns, or missing values. If the file contains structured numerical data, Quantitative Analysis can help generate statistical summaries, charts, outlier checks, and plain-language explanations. If the file is text-heavy — interviews, focus groups, or open-ended survey responses — Qualitative Analysis can identify themes, extract supporting quotes, and organize findings into a structured report.
For visual exploration, the Data Dashboard feature turns spreadsheet data into interactive chart-based views. For long PDFs, PDF Chat Analysis lets you open the document and ask questions while keeping the file visible on screen. When the analysis is complete, DataLumio helps turn findings into downloadable reports or chart outputs that can be reviewed, shared, or used in presentations.
This data analysis process is designed to reduce the time spent on repetitive setup work — so users can focus on understanding the data rather than preparing it.
Supported in Every Workflow
Upload Your Data
Upload CSV, Excel, PDF, or DOC files, or connect supported cloud files.
Clean and Prepare
Identify common data-quality problems before continuing to analysis.
Analyze and Visualize
Choose qualitative or quantitative analysis, analyze PDFs, or create dashboards.
Review and Share
Review findings, export reports, and use charts or cleaned datasets in your workflow.
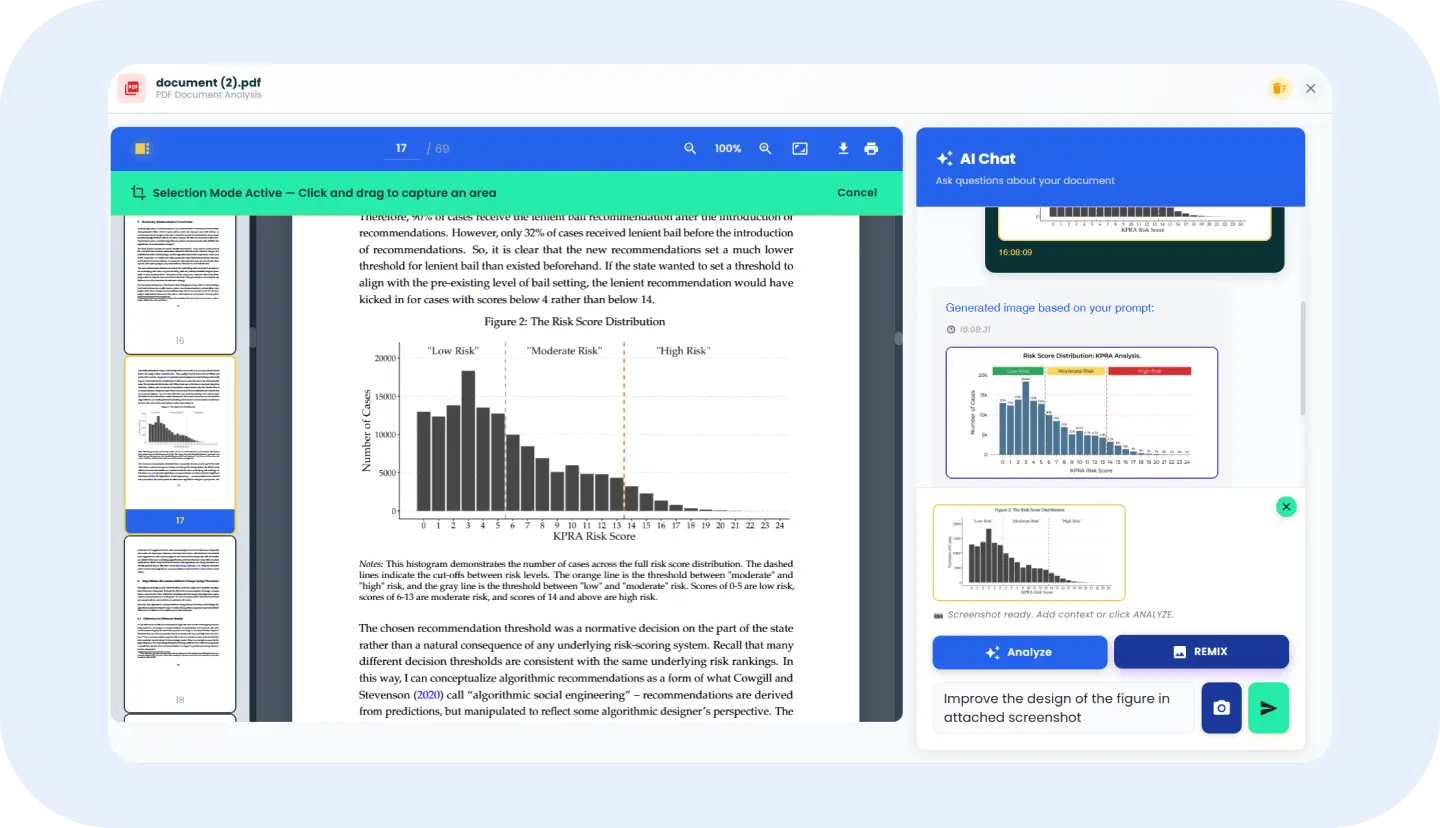
PDF Analyzer and AI PDF Analysis Tool for Long Documents
Qualitative Data Analysis Software for Interviews, Transcripts, and Surveys
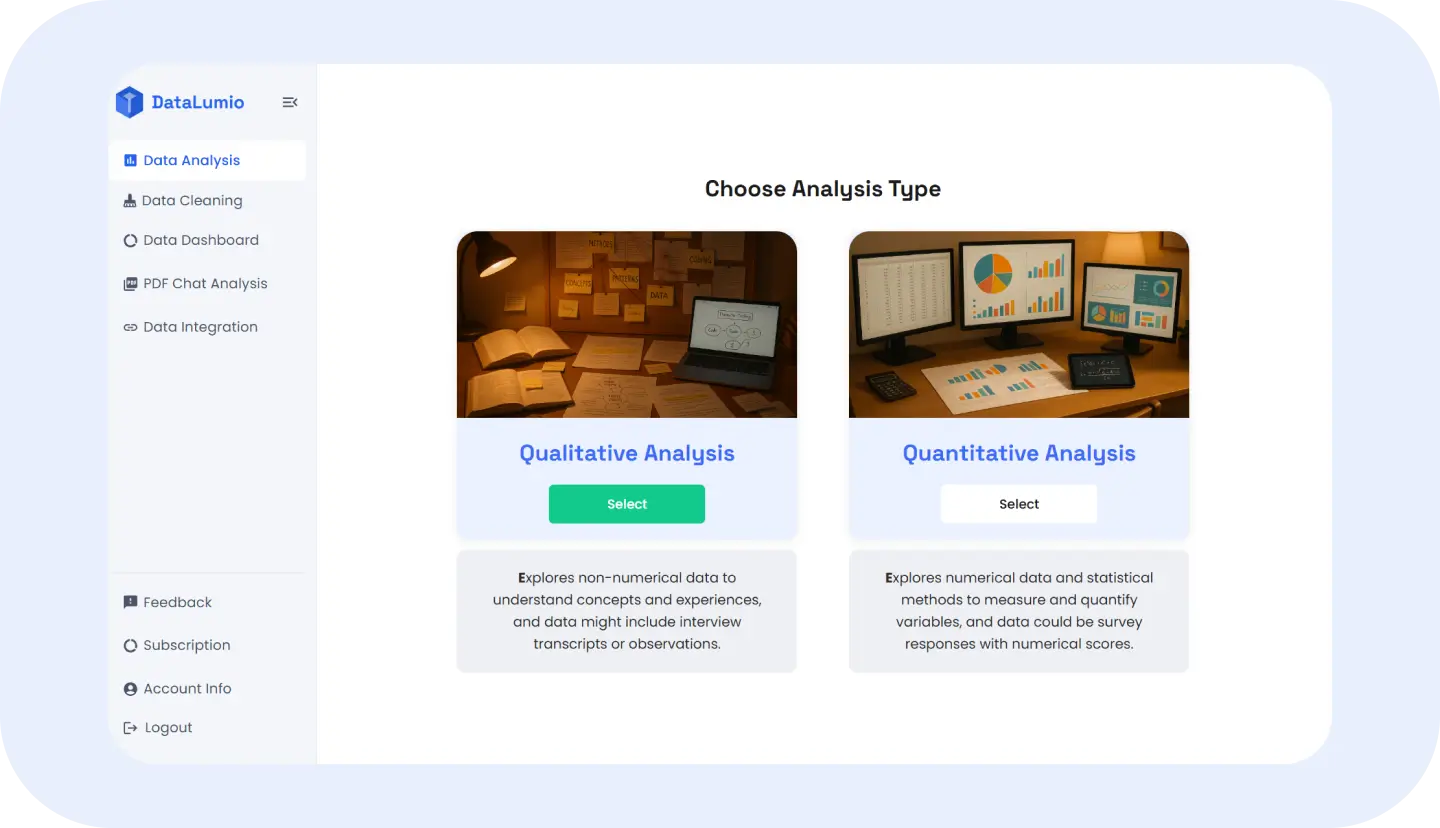
Quantitative Data Analysis Software for Research and Structured Data
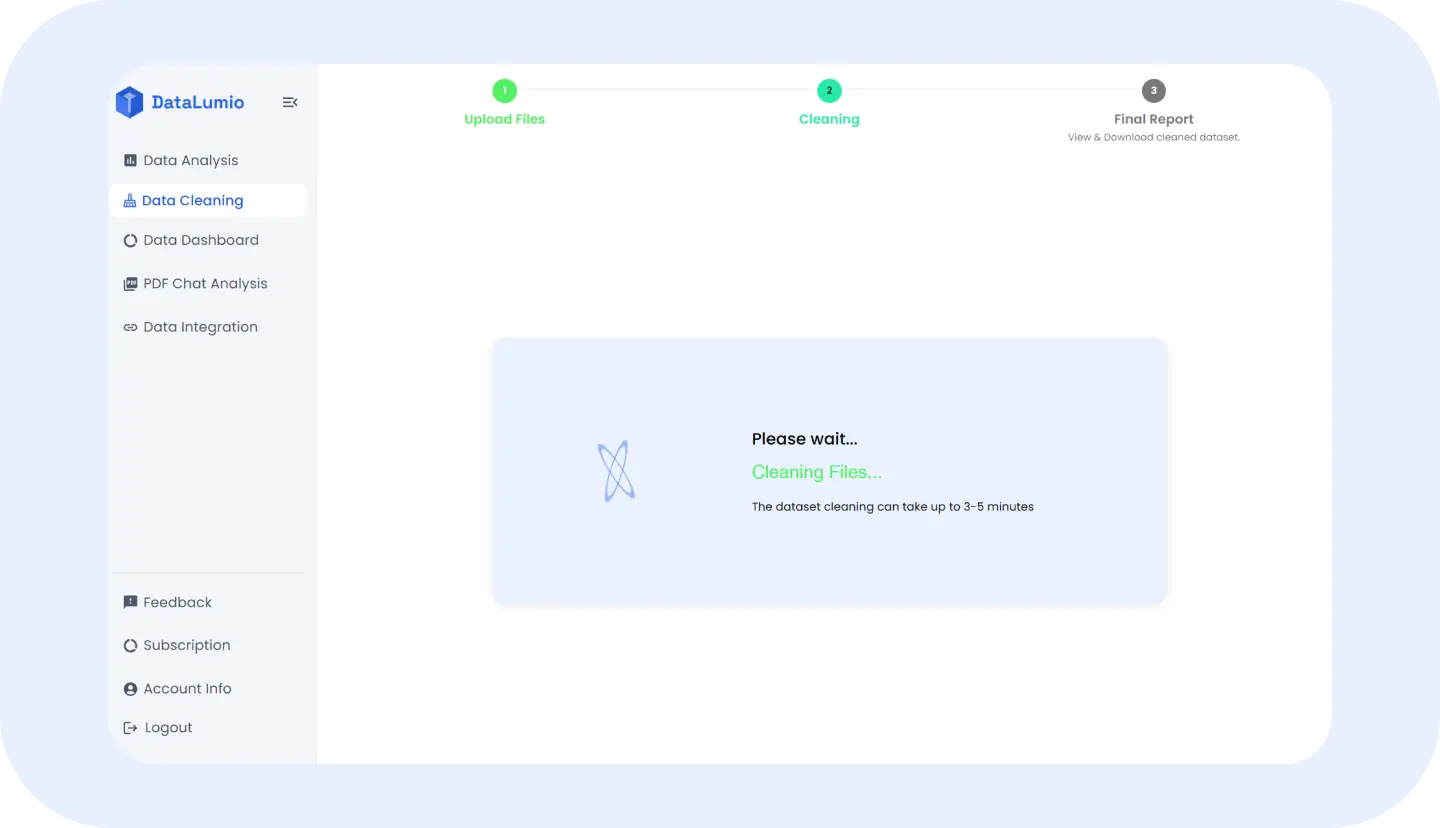
AI Data Cleaning Tools for Messy Spreadsheets and Datasets
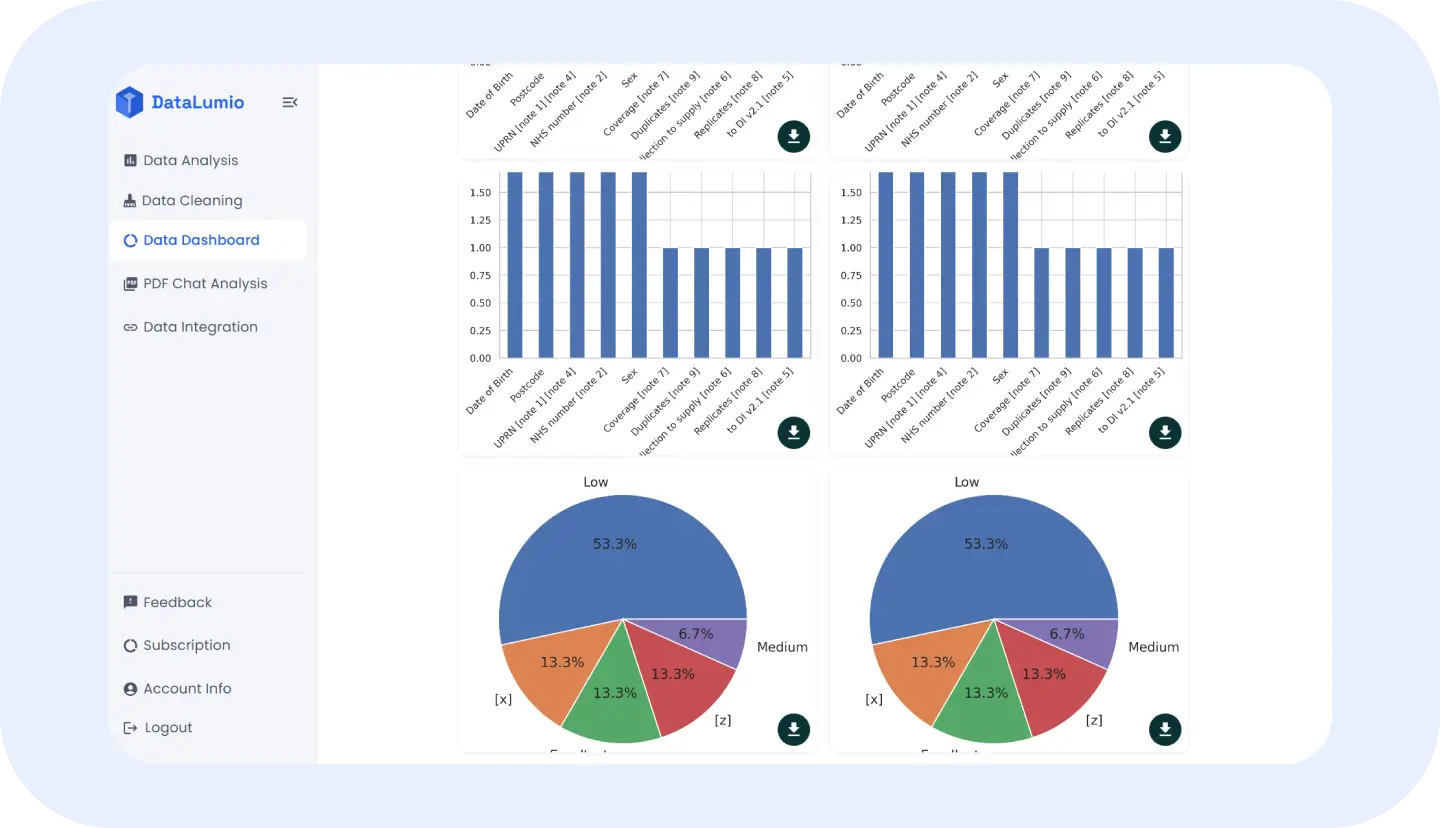
Data Visualization Dashboard for Clearer Business and Research Insights
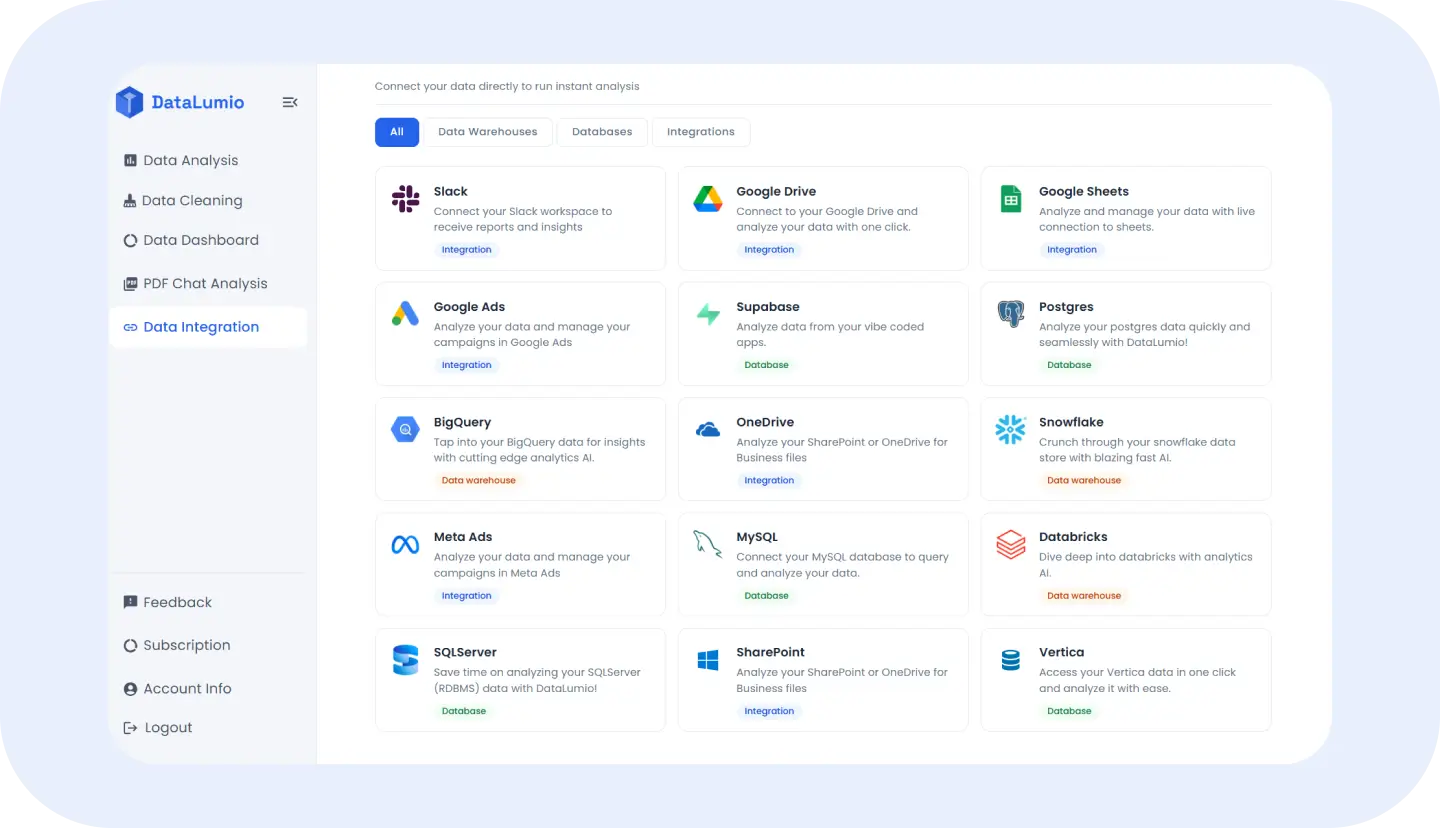
Data Integration Software to Connect Data From Multiple Sources
Compare Data Analysis Tools by Data Type, Use Case, and Output
Different types of data require different tools of data analysis. Use the comparison below to identify the DataLumio workflow that best fits your file and objective.
DataLumio is not a one-size-fits-all tool. Each feature is designed around a specific type of input. PDF Chat Analysis is best when you have a long document and want to ask questions about specific sections rather than reading it from start to finish. Qualitative Analysis is suited to interview transcripts, open-ended survey responses, and any text-heavy file where you need to find recurring themes and patterns. Quantitative Analysis works best with structured spreadsheet data where you want descriptive statistics, charts, and numerical comparisons.
If your spreadsheet is messy before analysis, start with Data Cleaning first, then move to Quantitative Analysis or the Dashboard. The Data Visualization Dashboard is useful when you want an interactive, visual view of your data rather than a written report. If your files are already stored in Google Drive, the Integration feature lets you connect directly without uploading manually.
| Data Analysis Tool | Supported Data | Best Use Cases | Primary Output |
|---|---|---|---|
| PDF Analysis Tool | Research papers, reports, long documents | Answers, summaries, document insights | |
| Qualitative Data Analysis | PDF, DOC | Interviews, transcripts, open-ended surveys | Themes, quotes, sentiment, findings |
| Quantitative Data Analysis | CSV, XLSX, XLS | Surveys, research datasets, structured data | Statistics, charts, comparisons |
| Data Cleaning Tools | CSV, XLSX, XLS | Messy datasets before analysis | Cleaner, analysis-ready data |
| Data Visualization Dashboard | CSV, XLSX, XLS, TSV | Visual reporting and exploration | Charts, KPIs, dashboard views |
| Data Integration | Connected files | Multi-source workflows | Connected data access |
| Automated Reports | Analysis outputs | Research and business reporting | Structured reports and summaries |
Who Can Use DataLumio's AI Data Analysis Software?
DataLumio is designed for people who need practical data analysis tools without unnecessary technical complexity.
Researchers and Students
Analyze interviews, research documents, survey data, PDFs, spreadsheets, and dissertation datasets using qualitative and quantitative workflows.
Business Analysts
Clean structured datasets, analyze performance information, explore trends, and create dashboards within one connected workflow.
Marketers and UX Teams
Analyze customer feedback, open-ended surveys, user research, campaign data, and other information to identify useful patterns.
Agencies and Consultants
Move from raw client files to organized findings, visual outputs, and structured reports while working across multiple file types.
Business Teams
Review sales information, customer data, operational reports, KPIs, and internal feedback without requiring specialist software for every task.
Organizations and NGOs
Analyze research documents, survey information, program data, stakeholder feedback, and mixed datasets using practical data analysis methods.
What People Say About DataLumio
Researchers, analysts, and students on how DataLumio fits into their data analysis workflow.

What I like about DataLumio is that it brings several data-analysis tasks into one fairly simple workspace. I can work with spreadsheets, PDFs, research documents, and connected files without having to constantly move between different tools.
The biggest advantage is the workflow. I can start with a raw file, analyze it, visualize the results, and produce a report without needing a complicated technical setup.
Read full review on Product Hunt →
DataLumio has been particularly useful for turning large amounts of qualitative research material into something I can actually work with. I don't have to manually code every document before I can start seeing patterns.
It gives me a useful first-pass analysis while still leaving the final interpretation and research decisions in my hands.
Read full review on Product Hunt →
What I like most about DataLumio is that it gives me both quantitative and qualitative analysis capabilities in one workflow. I don't have to move between several different tools just to understand the numbers and the text behind them.
The biggest benefit is the combination of simplicity and breadth. I can get useful analytical results without having to build the entire workflow manually.
Read full review on Product Hunt →
What I like most about DataLumio is that it makes the first stage of qualitative analysis much less time-consuming. I can upload interview transcripts or research documents and get a structured starting point instead of going through everything from scratch.
It doesn't replace my own judgement as a researcher, but it makes the initial analysis considerably faster and gives me a much better starting point.
Read full review on Product Hunt →Responsible AI Data Analysis With Human Review
DataLumio is built to speed up the data analysis process, not remove human judgment. AI can help identify patterns, summarize documents, generate charts, detect common data issues, and prepare reports faster than manual methods. But the data validation tools and outputs DataLumio produces should still be reviewed carefully before making decisions from them.
This is especially important for academic research, business strategy, financial reporting, policy review, and any workflow where accuracy matters. DataLumio's data analysis software is most useful when treated as a first-pass assistant — one that reduces repetitive setup work, organizes findings, and gives users a clearer starting point for their own review and interpretation.
Clear outputs also support this process. DataLumio aims to make results easier to understand through summaries, tables, visualizations, and plain-language explanations. This helps users see not only the output but also what it might suggest — without replacing the researcher's or analyst's own judgment about what the data actually means.
For sensitive work, users should follow their organization's privacy, security, and data handling policies. DataLumio does not use your uploaded data to train, fine-tune, or benchmark AI models.
Explore DataLumio's Data Analysis Tools and Features in Detail
Each DataLumio feature is designed around a specific stage or type of the data analysis process.
PDF Analyzer
Chat with PDFs, review long documents, ask questions, and analyze selected charts, tables, and visual areas.
Qualitative Data Analysis Software
Analyze interviews, transcripts, surveys, and research documents to identify themes, quotes, sentiment, and patterns.
Quantitative Data Analysis Software
Analyze structured datasets, survey responses, spreadsheets, and numerical information with statistical and visual outputs.
Data Cleaning Tools
Prepare supported CSV and Excel datasets by identifying common data-quality issues before analysis.
Data Visualization Dashboard
Transform structured datasets into charts, KPI views, comparisons, and interactive visual summaries.
Automated Reports
Generate structured reports from qualitative and quantitative analysis. Download summaries, charts, and theme breakdowns as starting-point documents.
Frequently Asked Questions About DataLumio Data Analysis Tools
What can I do with DataLumio?▼
DataLumio combines multiple data analysis tools in one platform. You can clean datasets, analyze qualitative and quantitative information, chat with PDFs, create data visualization dashboards, connect supported data sources, and generate structured outputs for research and business workflows.
What types of data can I analyze with DataLumio?▼
Different features support different data types. Qualitative analysis works with text-based research documents, while quantitative analysis and data cleaning support structured spreadsheet files. PDF analysis is designed for long documents, and dashboards work with supported structured datasets.
Can DataLumio be used as qualitative data analysis software?▼
Yes. DataLumio's qualitative data analysis software supports interviews, transcripts, focus groups, open-ended survey responses, field notes, and other text-based research materials. It can help organize themes, supporting quotes, sentiment, comparisons, and structured findings.
Can DataLumio perform quantitative data analysis?▼
Yes. DataLumio supports quantitative workflows for structured datasets such as survey responses, spreadsheets, business records, KPIs, and research data. Depending on the dataset, outputs can include statistical summaries, comparisons, charts, and other analytical insights.
Does DataLumio have data cleaning tools?▼
Yes. DataLumio includes data cleaning tools for supported CSV and Excel files. They can help identify common issues such as duplicate records, empty rows, blank columns, and missing values before analysis or visualization.
Can I create a data visualization dashboard with DataLumio?▼
Yes. DataLumio can transform supported structured datasets into visual dashboard views containing charts, KPI summaries, comparisons, trends, and other visual outputs. This makes it easier to explore and communicate important patterns in your data.
Does DataLumio offer data integration software?▼
Yes. DataLumio supports connected data workflows, including Google Drive integration. Users can access supported files through the connected workflow and continue with analysis without repeatedly downloading and uploading files.
Does DataLumio replace professional data analysis software?▼
DataLumio is designed to simplify and accelerate common data analysis workflows such as preparation, exploration, visualization, document analysis, and reporting. It should not replace expert statistical judgment or researcher interpretation when specialized or high-stakes analysis is required.
Choose the Right Data Analysis Tools for Your Workflow
Whether you need to clean a messy spreadsheet, analyze survey responses, identify themes in interviews, understand a long PDF, connect supported files, or build a data visualization dashboard, DataLumio brings essential data analysis tools together in one workspace.
Start Data Analysis →View Pricing